How the historical sample was selected
The original snapshot covered approximately 15.5 million Meta ad records. The analysis selected around 359,000 creative groups with at least two active copies and classified approximately 51,000 creatives using product titles and destination URLs. These classified creatives had around 262,000 active ads.
The table reflects that classified subset, not a representative census of dropshipping. Unclassified creatives were excluded. We used multiple copies as the selection criterion, because a creative a store keeps duplicating is usually one that sells. Store fulfilment models were not verified.
The snapshot covered several countries. Repeat research for your country and language. These historical figures are not current market totals.
Compare the 10 niches on the same basis
Active ads describe observed advertising activity; stores are identified domains in the sample. Video share helps choose formats to inspect. Duration records how long creatives had been observed. Together, these measures show where stores are investing, which is the best public sign of where the sales are.
The original price column combined different currencies. It has been removed: compare current offers in the same currency, for the same variant and with delivery included.
| Niche | Live ads | Stores | Video | Days live | Copied |
|---|---|---|---|---|---|
| Fashion & jewelry | 59,757 | 2,258 | 57% | 31 | 6% |
| Beauty | 51,009 | 2,102 | 75% | 31 | 7% |
| Home & kitchen | 37,627 | 2,094 | 72% | 25 | 15% |
| Tech & gadgets | 23,006 | 958 | 82% | 28 | 14% |
| Health & wellness | 20,722 | 992 | 64% | 26 | 5% |
| Fitness | 14,938 | 829 | 72% | 25 | 9% |
| Auto | 14,752 | 708 | 79% | 26 | 16% |
| Baby & kids | 14,550 | 895 | 62% | 31 | 10% |
| Pets | 14,111 | 895 | 53% | 25 | 7% |
| Outdoor & garden | 11,241 | 817 | 64% | 30 | 8% |
Historical sample: 11 September 2026. Days live: median observed creative duration. Copied: share associated with at least three advertisers, not necessarily independent stores. Categories may overlap; do not add store counts. Not a sales or whole-market ranking.
Fashion, jewellery and beauty: compare the specific offer
Fashion and jewellery had 59,757 active ads in the classified sample; beauty had 51,009. So much activity is a sign that these niches sell. For a new store, the challenge is finding a product and an offer that stand out among so much competition.
Compare sizing, variants, demonstrations and delivery terms. In beauty, 75% of observed creatives were videos. Use that as a prompt to inspect examples, not a requirement for every offer.
Home, kitchen and auto: look for a demonstrable use
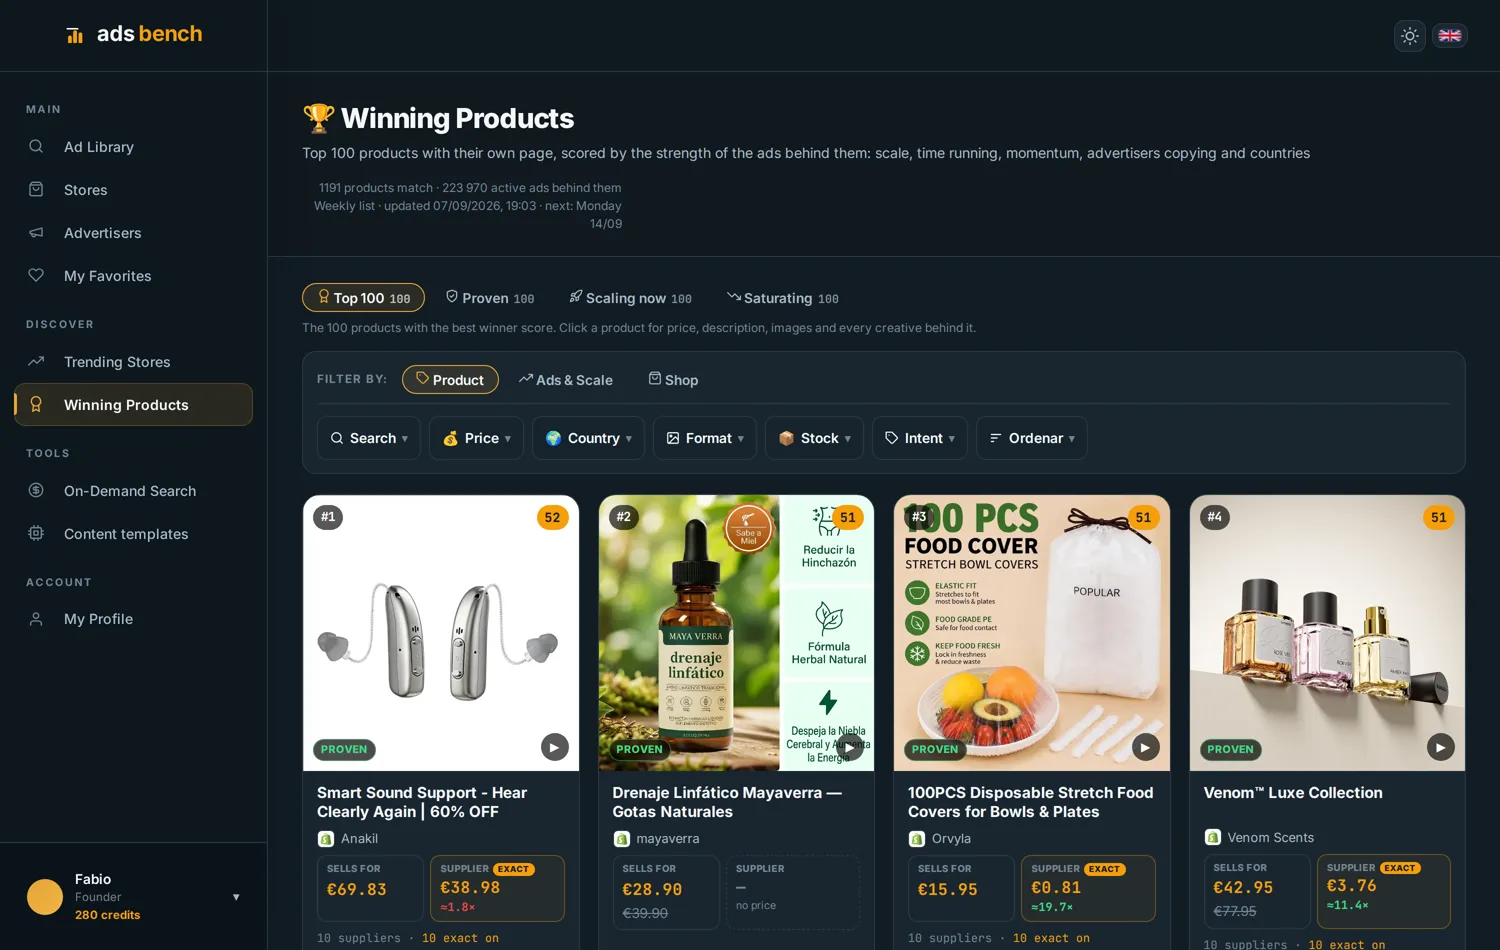
Home and kitchen had 37,627 active ads; auto had 14,752. The shares of creatives associated with at least three advertisers were 15% and 16%. Shared material may reflect multiple pages or reuse; it does not establish dropshipping.
Choose a specific use case and check sample quality, compatibility, delivery and competing offers. A familiar item can differ by variant or bundle. Compare equivalent products.
Tech and other niches: narrow the market
Tech creatives had an 82% video share in the sample. Inspect whether the demonstration explains a useful function and whether you can verify it on a sample.
For fitness, pets, baby and outdoor products, research customer needs and fulfilment requirements separately. Observations across countries do not establish opportunity in your own market. An active ad does not verify product suitability or claims.
A practical checklist for choosing a niche
Pick a customer group you understand, a country you can serve and a need you can explain. Compare stores and record their offers. Verify suppliers and delivery before choosing a test.
Use ad counts to find research material, not to infer market size. Average ads per store cannot show concentration; large advertisers can distort the average.
Next, follow the product research workflow, check saturation and compare suppliers.
Exercise: turn a niche into three product candidates
In the historical sample above, 75% of beauty creatives and 72% of home and kitchen creatives were videos. These figures help you find material to review; they cannot identify the most profitable niche.
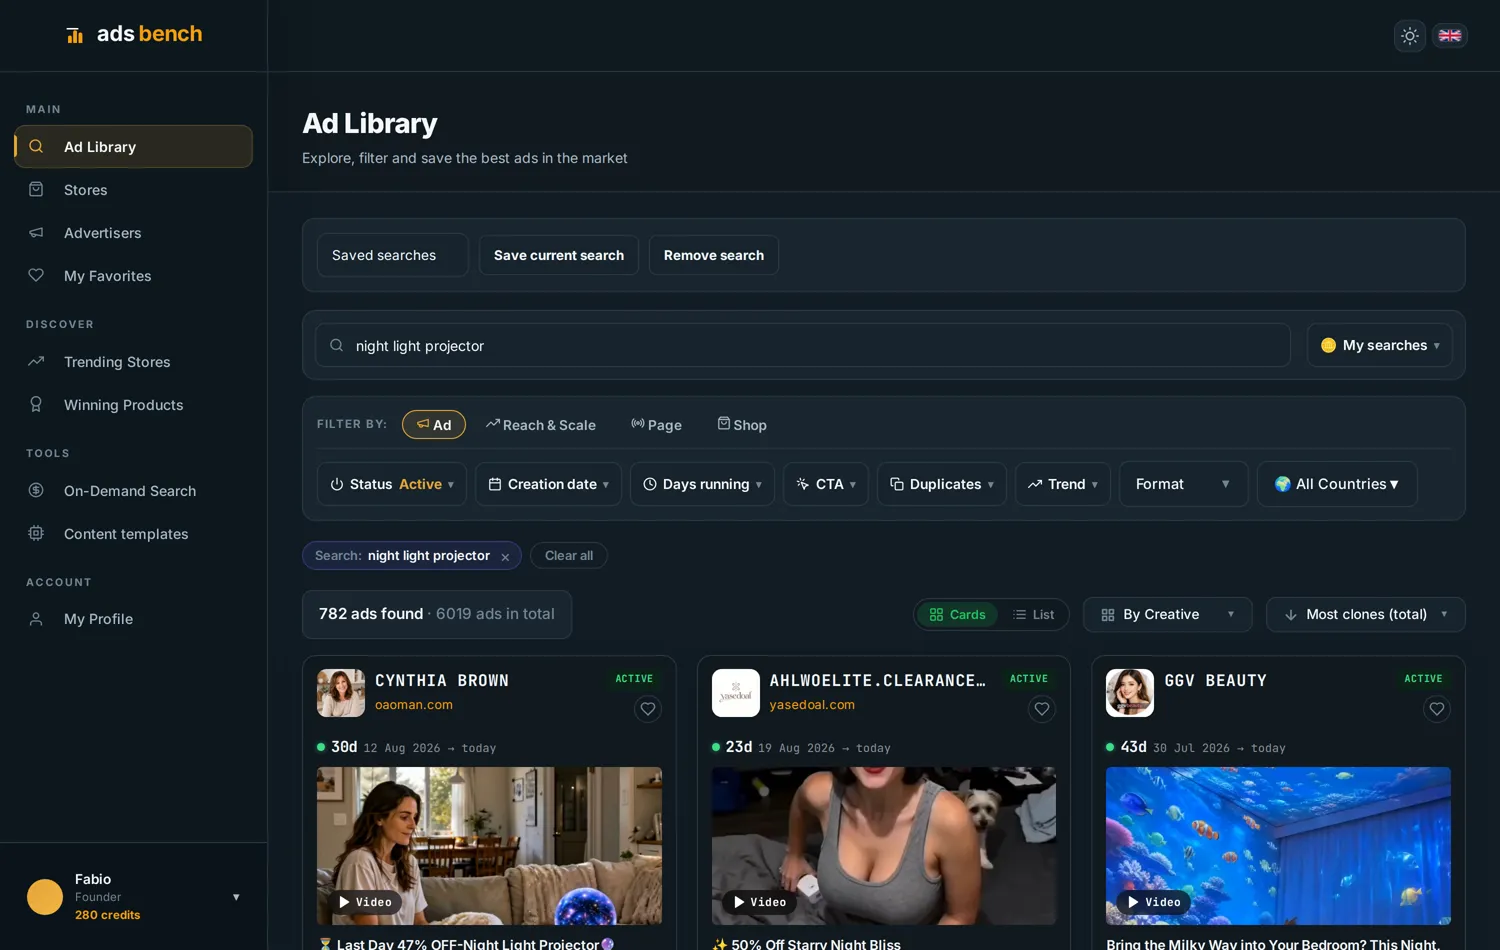
Open the public beauty selection or home and kitchen selection. Pick three products and record the customer need, your target country, the variant and the observation date for each.
Compare the offers and flag what still needs checking: delivered price, delivery time or quality. Finish with one candidate to investigate and a reason to set the others aside. Continue with the product saturation checklist.
Questions about dropshipping niches
What is the most profitable niche? This dataset cannot answer that. Profit depends on the offer, sourcing, acquisition costs and fulfilment.
Which niche is best for beginners? Start where you can understand the buyer, verify the product and deliver reliably. The largest ad count is not a beginner recommendation.
Does more advertising prove demand? It shows advertising activity. Validate your own offer with evidence from your own customers and sales.
Source: Ads Bench sample originally published on 11 September 2026. Original counts retained; interpretation reviewed on 21 September 2026. This update is not a new data collection.